


This year has started out quite interestingly. To begin with, we got the nice “first week of January” indicator, which I shared. Basically, when the first five trading days are positive in cumulative return and it follows years as we have had, there tends to be a high probability of a positive return for this year.
On top of the statistical data of the first week, we have also had a couple of other major international things going on, mainly Venezuela, and Greenland. Since Venezuela seemed to come and go without even so much as a whimper in the press, and the financial markets, I wanted to take a moment and talk a bit about Greenland.
On Greenland
The "Greenland drama" that seems to have ended with a whimper as well, is part of Trump's style. He tends to take actions that shock markets then quickly find a resolution that satisfies markets. This event seems to have been no different. More importantly than the event but instead looking at it as just “an event,” I looked back to see how markets tended to react afterwards.
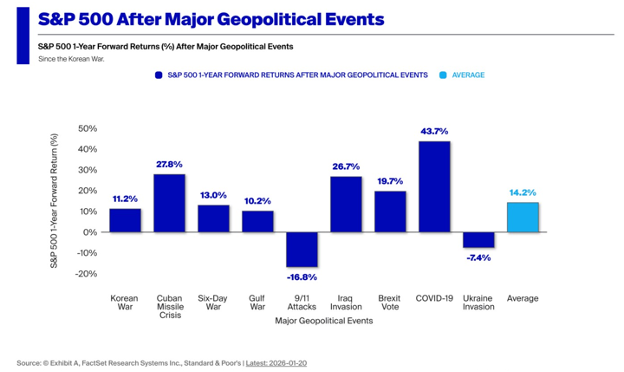
Historically, the S&P 500 after major geopolitical events was up double digits a year after each event. Only in 2 of 8 cases was the S&P 500 lower:
- After the 9/11 attacked in 2001 due to the dot-com bubble burst and recession.
- After the Ukraine invasion due to the aggressive tightening by central banks leading to substantially slower quantitative easing (QE) which has always resulted in lower markets.
Markets have repeatedly shown that political shocks rarely translate into lasting damage to fundamentals. This is what has happened back to the post-World War II era:
The point that I am making is not to say that these are not important and concerning actions that are being taken by the administration, but instead to look beyond the specific action and try to handicap the action of the financial markets following the international issue. If one were to look at the “why” there is an action being taken in Greenland, this is the list of reasons that I could find:

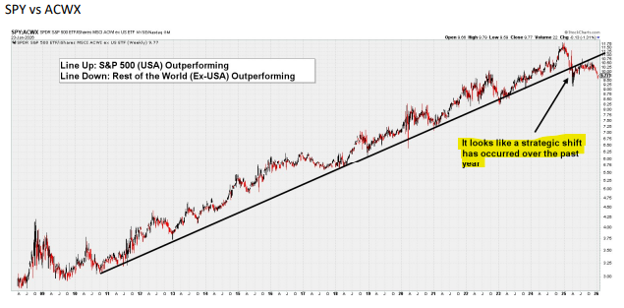
The next point I wanted to cover in this week’s note is one of understanding how and possibly why there has been this transition from the big technology companies having the limelight and now a different set of companies, both domestic and foreign capturing the lead in market performance currently. there appears to have been a strategic shift away from the U.S. and into the rest of the world in recent times that suggests we can no longer ignore the investment landscape outside of America's borders. The "sell America" trade began to gather steam early last year amid the whirlwind of threatened tariffs after President Trump took office for a second term.
Global equity measures largely outperformed U.S. measures in 2025 even as American stocks enjoyed another constructive year. We can also likely trace much of the huge move into precious metals over the past couple of years to a strategic shift away from dollar-denominated assets.
So let me take you to the math for just a second. As of December 2025, the combined market capitalization of the "Mag 7" stocks reached approximately $21.68 trillion, representing over 35% of the total S&P 500 market value. Excluding these seven companies, the remaining ~493 companies comprised roughly $35 trillion to $38 trillion in market capitalization. Taking into account the international market size as well, according to Google, the European stock market has a value of approximately $22.71 Trillion and the entire emerging market basket $11.76 Trillion.
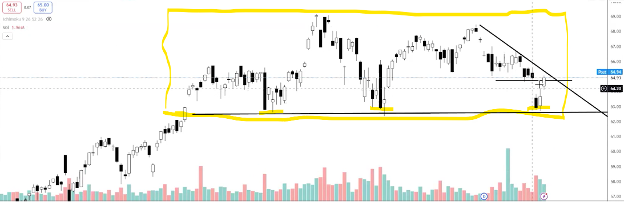
Why is this important? Because, if we look at that gross value of this heavily concentrated group, compared to the rest of the entire parts of the US, Foreign, and Emerging Markets, it is clear that this is a massively valued group. So, if the investment world were to say, “Hey, the rest of the world (ex-US) and the rest of the US markets (the other 493 members of the S&P 500) were to be given a bit of attention, it would require a very small amount of selling in this Mag 7 to fund what could create a massive move in far less liquid, and smaller markets. If we are to reference the picture below of the price movement of the Magnificent 7 collectively, they went up huge since October of 2022, and now they are taking a breather. Does this mean the advance is over? Well, we won’t know this till we see something happening in the price moves to tell us so. But what I have a hunch is happening, is that when partial profits are taken from these long standing holdings, their size is so immense (as I have given the numbers for above) that when some of this value is moved to the other 493 companies and foreign markets, that have been sleeping during this period on a comparative basis, this is enough money to really blast these companies to the upside. Notice the movement in the emerging market index and the US small-cap index since the beginning of the year.
That said, it is difficult to imagine a scenario in which the United States stock market and specifically the Mag 7, does terrible over the next several years while equities in the rest of the world boom. It's possible, but not something I believe to be likely. Even over the past couple of decades, it hasn't necessarily been that global markets have done poorly while the U.S. markets have gone up, up, up. It's just that U.S. markets have done better on a relative basis than markets abroad.
While the first half of January is a relatively short time frame, it does seem to indicate whether recent momentum or the broad S&P will win out the rest of the year. Going back to 1993, the winner of the first half of January went on to outperform on an annual basis nearly 75% of the time. Therefore, a strong start by momentum is usually a positive sign that the rest of the year will be a good one on a relative basis. Over the last decade, the winner of the first two weeks of January went on to have the better year eight out of ten times and has been correct the last four years (2022 – 2025). This start of the year momentum has beaten S&P in the first half of January the last three years (2024 – 2026). While basing investment decisions purely on the first two weeks of January would be ill-advised, the historical tendencies point to backing the strong horse even if it is just out of the gate.
As I normally do, I take some time to look at earnings and earnings progression / forecasts going forward. Again, the yardstick continues to be the Mag 7.More on earnings...time for the Mag 7 to hand it off to the 493? Not so fast.
- We’ve been hearing this call for years now.
- And all the prognosticators keep doing is moving the goalposts out another year.
- And another year.
- And another.
- We pulled Bloomberg’s estimates for income growth year on year for various groups within the S&P500®.
- And what do we see?
- The hand off for the Mag 7 to the 493 in terms of earnings leadership hasn’t yet started in 2026.
- The gap is narrowing. Sure. But the Mag 7 still retains supremacy.
- The S&P 500®ex tech is kinda meh. The 493 does better than this at least.
- The S&P 500®tech is rocking and rolling. Just crushing it.
- Just a few names you say?
- Well, we stripped out the three biggest and it’s still strong.
- The point? Tech is still ruling the roost in terms of EPS growth.
- Mag 7 or not – it’s strong.
- Bubble? Overpriced?
- Avoid at your own peril.
We aren’t in a bubble. We can argue about the hyperscalers and their ability to continue the pace and size of their CapEx spend. But that’s a different story. When earnings are driving a significant portion of total returns, that’s a good thing. Broadening out? We’d love to see it. But we also appreciate that tech is here to stay. And that the earnings coming from tech are still outsized. The narrative will shift as the AI cycle morphs from one thing to the next. First, it was giving the benefit of the doubt to the hyperscalers. That morphed into “show me the money” (or ROI). But the infrastructure players associated with the AI story (CapEx receivers) took the lead. And maybe nowit’s show time – show us the benefits of using AI(productivity gains and margin expansion). Those who can demonstrate this might be the winners in 2026. This might include financials, industrials and health care. But regardless, the backdrop is still supportive as earnings growth and a supportive Fed keep recession odds low. Risk on. Given Trump’s actions to control our US consumption of natural resources, trace elements, gold, and oil, the international markets, specifically the emerging markets have come back to life. To see what has been happening of late, I put together a chart showing how the US S&P 500 is doing relative to the international markets.
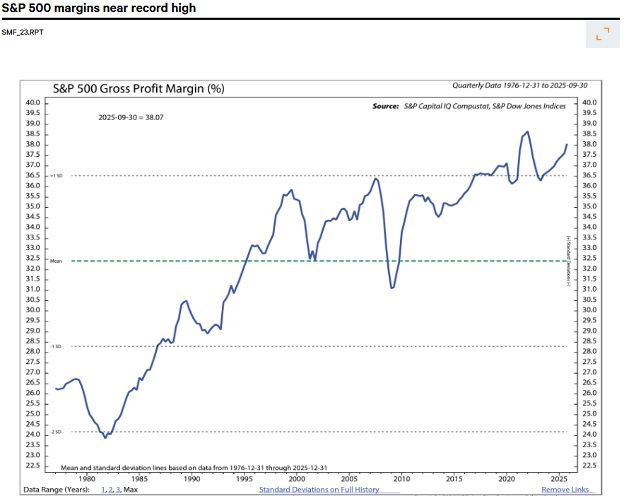
Just to reflect one more time on why it still makes sense to keep a continued focus on US companies, I look at the profit margins of companies. Some attribute this to AI, but I attribute it to US ingenuity. Companies have successfully defended profit margins amid the rapidly evolving trade landscape over the past year. Following the implementation and subsequent negotiations on reciprocal tariffs, the average tariff rate on dutiable imports jumped from 8% to a record high 25% at the end of October. To protect margins, corporations have taken several steps beyond price hikes. By front running the tariffs and stocking up on inventory prior to the levies going into effect, companies provided themselves a low-cost buffer that preserved margins over the near term. The move bought time for more structural changes, including rerouting supply chains to lower tariff countries, reducing work forces, and prioritizing efficiency gains via AI. After flatlining for roughly two years, the S&P 500’s average sales per employee ratio hit a record high in 2025, and the index’s margins continued to expand despite the tariff headwind, sitting near a record high at the end of Q3.
Going back to the 1980’s this is the progression of gross profit margin for S&P 500 companies:
Margin resilience has not come only from the tech-related mega-caps. Seven of 11 S&P 500 sectors had rising year-over-year gross profit margins as of the end of Q3. While the chart shows that all Growth sectors – Consumer Discretionary, Technology, and Communication Services – are included on the list, Value sectors like Energy, Materials, Financials, and even Consumer Staples have seen margins expand as well. Margin trends at the industry level also remain positive, with more than 70% of S&P 500 industries with rising gross profit margins as of Q3.
The charts suggest tariffs have been a manageable headwind that has not yet derailed the broader earnings cycle. A high percentage of sectors and industries with rising margins has been consistent with strong returns from the S&P 500, historically.
In closing, we are beginning a good year once again. For the last two weeks, not so much as it is the first time since June of last year that we have seen two back-to-back weeks of negative returns on the S&P 500. But these negative two weeks have done little to break the back of the uptrend in the markets. Instead, we have seen some breakout moves in industrial metals, precious metals, and foreign markets- bot developed and emerging. We will be sure to keep you involved and engaged in these recognizable market events.
Important Disclosures:
The opinions voiced in this material are for general information only and are not intended to provide specific advice or recommendations for any individual. To determine which investment(s) may be appropriate for you, consult your financial professional prior to investing. All performance referenced is historical and is no guarantee of future results. All indices are unmanaged and cannot be invested into directly.
All information is believed to be from reliable sources; however LPL Financial makes no representation as to its completeness or accuracy.
Investing involves risks including possible loss of principal.
The Standard & Poor's 500 Index is a capitalization weighted index of 500 stocks designed to measure performance of the broad domestic economy through changes in the aggregate market value of 500 stocks representing all major industries. The S&P 500 is a stock market index tracking the stock performance of 500 of the largest companies listed on stock exchanges in the United States. Indexes are unmanaged and cannot be invested in directly.
The Dow Jones Industrial Average is comprised of 30 stocks that are major factors in their industries and widely held by individuals and institutional investors.
The Nasdaq-100 is a large-cap growth index. It includes 100 of the largest domestic and international non-financial companies listed on the Nasdaq Stock Market based on market capitalization.
The Russell 2000 Index is an unmanaged index generally representative of the 2,000 smallest companies in the Russell 3000 index, which represents approximately 10% of the total market capitalization of the Russell 3000 Index.
Data sourced from Bloomberg (2025).
Stock investing includes risks, including fluctuating prices and loss of principal.
Bonds are subject to market and interest rate risk if sold prior to maturity. Bond values will decline as interest rates rise. Bonds are subject to availability, change in price, call features and credit risk.
Government bonds are guaranteed by the US government as to the timely payment of principal and interest and, if held to maturity, offer a fixed rate of return and fixed principal value.
Bond yields are subject to change. Certain call or special redemption features may exist which could impact yield.
International investing involves special risks such as currency fluctuation and political instability and may not be suitable for all investors.
Alternative investments may not be suitable for all investors and should be considered as an investment for the risk capital portion of the investor’s portfolio. The strategies employed in the management of alternative investments may accelerate the velocity of potential losses.
This information is not intended to be a substitute for specific individualized tax advice. We suggest that you discuss your specific tax issues with a qualified tax advisor.
The economic forecasts set forth in this material may not develop as predicted and there can be no guarantee that strategies promoted will be successful.
LPL Tracking #1055516